Observed cases of MAL and ADD
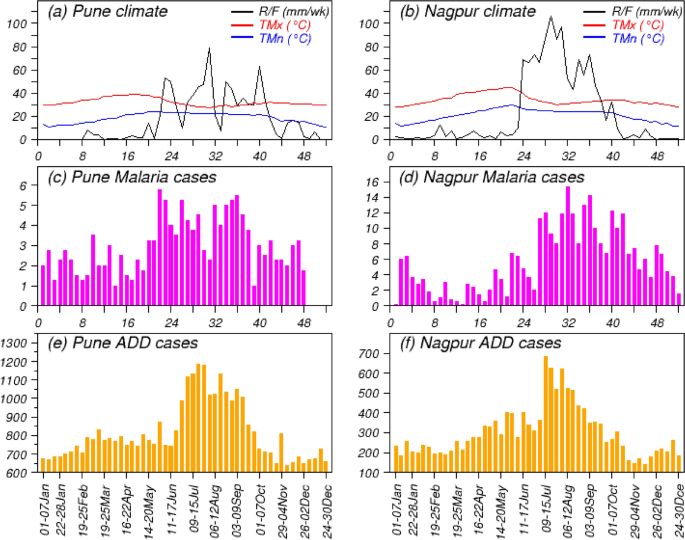
The actual recorded weekly mean of MAL and ADD cases along with the climatological rainfall (hereafter R/F), maximum temperature (hereafter TMx) and minimum temperature (hereafter TMn) over PNE and NGP regions are shown in Fig. 1 (X axes represent the weeks of a calendar year and Y axes for R/F or TMx or TMn or average cases of MAL or ADD). The Fig. 1a and b represent climatological values of R/F, TMx and TMn over PNE and NGP respectively. It is seen that rainy season over PNE lasts from June to mid-October, whereas over NGP it lasts for June–September (JJAS). TMx and Tmin are higher over both the regions during pre-monsoon months of March–May and drop down during monsoon months (JJAS). Figure 1c and d show the MAL cases and Fig. 1e and f show the ADD cases over PNE and NGP respectively. It is found that NGP experiences more MAL cases as compared to PNE, whereas PNE experiences more ADD cases compared to NGP (as per record). PNE experiences more or less constant number of ADD cases during all seasons except an increase during Mid-June to September, whereas over NGP the magnitude of ADD cases is more during July to August months as compared to other seasons. MAL cases are observed more before and during monsoon season over PNE. In contrast, the MAL cases are more after one month of monsoon onset to post monsoon month over NGP. This type of variability in magnitudes and duration may be attributed to the different geographical positions and different climatic conditions (as seen in Fig. 1a and b) of these two places. So, the variation in R/F distribution, variation in TMx and TMn over these two regions may play a major role behind the seasonality of the MAL and ADD incidences.

Observed climatological weekly average: (a) and (b) R/F, TMx and TMn; (c) and (d) number of MAL cases; and (e) and (f) number of ADD cases over Pune and Nagpur respectively. The scales on Y-axes are same for R/F, TMx and TMn in (a) and (b).
Mean map obtained from 3 × 3 SOM clustering
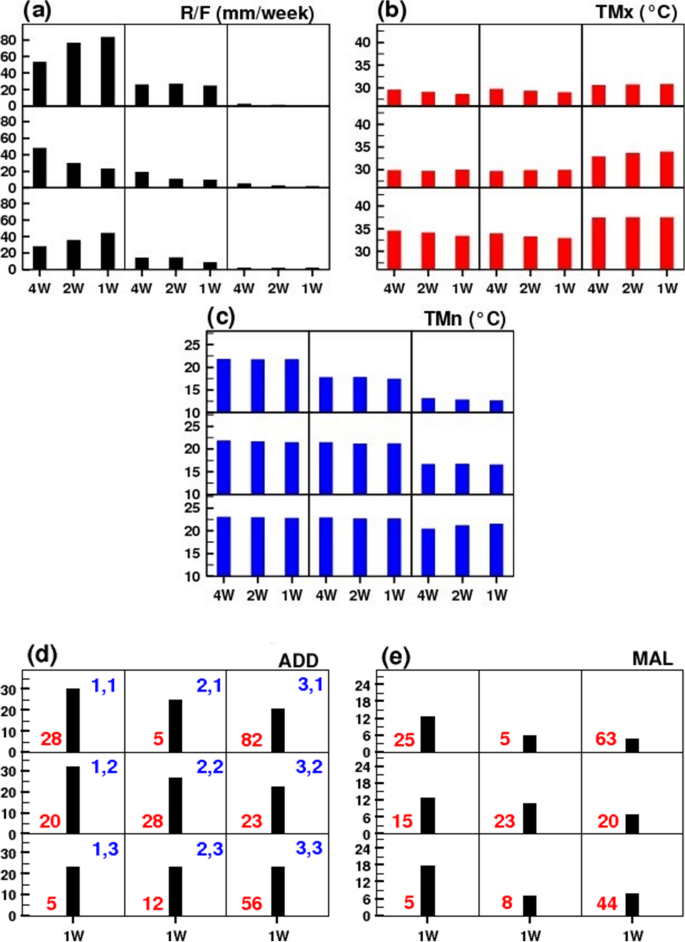
Figure 2 shows the mean map obtained from all cases clustered in individual node for R/F, TMx, TMn and MAL for PNE. In 9 sub-panels (corresponds to each individual node) of Fig. 2a–c, the mean values for 1 W (current week), 2 W (average of current week and previous week) and 4 W (average of current week and last three weeks) of R/F, TMx and TMn are plotted. Figure 2d and e represent average cases of ADD (per 1,00,000 populations) and MAL (per 10 Million populations) in each node only for 1 W (i.e. current week) (please refer Data and Methods section) respectively. The positions of the nodes are mentioned on the right-top of each sub-panel (Fig. 2d) by the notation x,y and the numbers of clustered cases are also mentioned in red colour for ADD and MAL (Fig. 2d and e). From Fig. 2d,e, it is observed that, the higher valued ADD cases are clustered in nodes (1,1) and (1,2) and higher valued MAL cases are in node (1,3), while the minimum valued cases are clustered in node (3,1) for both ADD and MAL. It is seen that the large number of ADD and MAL cases are associated with moderate to heavy R/F activities, higher TMn and moderate TMx values in all 1w, 2w and 4w weeks. It is noted that the highest cases of ADD (node (1,2)) is associated with (i) the highest amount of R/F during week 4 W (48 mm/week) and with decreasing amount from week 4 W to 1 W (23 mm/week), (ii) relatively high values of TMn ((sim 21.5^circ{rm C})) during all 4 weeks and (iii) moderate TMx values ((sim 30^circ{rm C})) during all 4 weeks. On the other hand, highest cases of MAL (node (1,3) is associated with (i) the highest amount of R/F during current week 1 W (44 mm/week) and with decreasing amount from week 1 W to 4 W (27 mm/week), (ii) relatively high values of TMn ((sim 23^circ{rm C})) during all 4 weeks and (iii) moderate to high TMx values ((sim 34^circ{rm C})) during all 4 weeks. The least number of ADD and MAL cases (in node (3,1)) can be linked with very dry condition, moderate TMx ((sim 31^circ{rm C})) and low TMn ((sim 13^circ{rm C})) values. So, it can be concluded that the thresholds of climatic variables for the outbreaks are different for different diseases over PNE.

Mean map of all the cases clustered in each of 9 nodes obtained from 3 × 3 SOM clustering for Pune: (a) R/F, (b) TMx, (c) TMn and (d) ADD cases (per 1,00,000 populations) and (e) MAL cases (per 10 million populations). Here, the positions of the nodes are mentioned on right-top of the each sub-panel of (d) and the numbers of cases are mentioned in red colour for ADD and MAL (in d and e).
The similar mean map for NGP region is obtained (please refer Supplementary Figure S2) and it found that over this region the highest number of ADD and MAL cases (node (1,1)) are associated with the heavy R/F activities in all 4 weeks (range: 93–104 mm/week), high TMn ((sim 24^circ{rm C} )) and moderate TMx values ((range: 31-32^circ{rm C} )) in all 4 weeks. The lowest ADD cases (node (3,1)) are observed to link with no rain, low TMn ((sim 15^circ{rm C} )) and moderate TMx ((sim 31^circ{rm C} )). Whereas the lowest cases of MAL (node (3,3)) are linked with no rain, very high TMx ((sim 42^circ{rm C} )) and considerably high Tmn ((sim 25-26^circ{rm C} )). Therefore, it is found that over these two regions the outbreaks and lowest cases of ADD and MAL are strongly linked to the different thresholds of weather parameters, i.e., on different weather conditions.
The actual distributions of these 3 weather parameters and 2 diseases around the mean in different nodes are presented through the Box-and-Whisker diagrams30 in Supplementary Information by Figure S3 and S4 for PNE and NGP respectively.
Class probabilities obtained from 3 × 3 SOM clustering
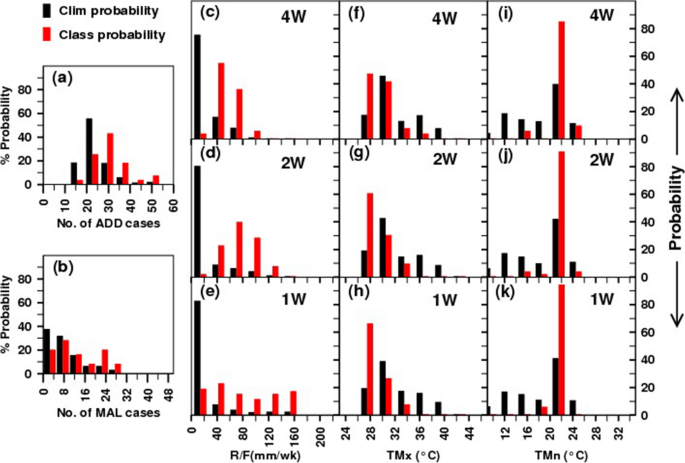
The class probabilities (red bars) along with the climatological probabilities (black bars) of three weather parameters and the disease cases are shown in Fig. 3 for the node (1,1) (as an example) for PNE, where the number of ADD and MAL cases are found larger. Class probability means the probability of getting a certain value in that particular node among the cases clustered into that node, whereas the climatological probability represents the same but considering all the 9 nodes together. The class probabilities and the climatological probabilities of getting different number of ADD and MAL cases are presented in Fig. 3a and b respectively. Similarly the same probabilities for R/F, TMx and TMn are plotted in panel c-e, f–h and i-k respectively with different time steps i.e. 4 W, 2 W and 1 W. It is found that the increased probabilities of wet spell, high TMn and moderate TMx are more conducive for large number of ADD and MAL cases (Fig. 3a–k). Similarly from the class probabilities of node (3,1) (please refer Supplementary Figure S5), it is observed that, the increased probabilities of dry spell, low TMn and moderate TMx are less conducive for ADD and MAL over PNE. Also, from the probabilistic analysis for NGP region (please refer Supplementary Figure S6-7), it is found that the increased probabilities of heavy to very heavy R/F (less R/F), high to very high TMn (low to medium TMn) and low TMx (moderate to high TMx) are more (less) conducive for ADD and MAL over this region.

Class probabilities (red bars) with climatological probabilities (black bars) of: (a) ADD; (b) MAL; (c)–(e) R/F for 1w, 2w and 4w time steps; (f)–(h) TMx for 1w, 2w and 4w time steps and (i)–(k) TMn for 1w, 2w and 4w time steps for node (1,1) and for Pune.
Skill of the 6 × 6 SOM based EHWS
Before implementing the real-time prediction of the disease incidences, it is essential to check the skill of this EHWS. To evaluate the skill, the Correlation Coefficient (CC), Root Mean Square Error (RMSE) and Brier Skill Scores (BSS)31 for different categorical probabilistic forecasts are calculated with respect to the actual observations for MAL and ADD over the two regions separately. To calculate the CC and RMSE, the deterministic forecasts are used after removing the climatological bias (also the CC and RMSE values without bias correction are placed in Supplementary Table S2). The CC, RMSE and BSS for Below Normal (BN), Near Normal (NN) and Above Normal (AN) (please refer Data and Methods section) along with the climatological skill scores (presented inside the brackets) are listed in Table 1 for 6 × 6 SOM analysis. It can be noticed that for the prediction system, the CC values for MAL and ADD over these two regions are ~ 0.7 or more and also the RMSE values are reasonable i.e. ~ 5 or less cases (except for NGP MAL i.e. ~ 15). Also, we can see that the CC and RMSE values for the model are better than the same calculated from climatological forecasts. For the perfect forecast, the value of BSS is 1 and for no skill it is 0 and if it is negative, then the forecast quality is poorer than the climatology. The positive value indicates good forecast quality, so higher is the value more improvement in the forecast compared to the climatology. From the table it is seen, the BSS values are all positive for all BN, NN and AN categories and showing higher skills as compared to the climatology over both the regions and for both MAL and ADD. Thus, analysis of the skill scores indicates that the EHWS always exhibits better forecasting ability than the climatology, and it is much better for probabilistic forecasts.
So, the above skill analysis gives us the confidence to use this EHWS based on 6 × 6 SOM techniques for the real-time prediction of such disease incidences over any other places of India.
Prediction and verification of disease incidences
The weekwise deterministic as well as the categorical probabilistic forecasts of MAL and ADD cases are produced during the analysis period (2009–16) for all the years and for both the regions by using 6 × 6 SOM technique and weather parameters as predictors. Figure 4a shows the weekly actual recorded cases (black bars), the deterministic predicted (bias-corrected) values (red bars) and the climatology (blue line) of MAL during year 2013 for NGP as an example. From Fig. 4a, it can be noted that the variability of the occurrence of MAL over this region over different season is nicely captured by the SOM based EHWS. Though, it failed to predict the actual number of cases that occurred in a few occasions. For example, the predicted number of MAL cases during few weeks are either much less (e.g. week no. 2, 3, 22, 23, 25, 27, 28, 36, 37, 38 and 39) or much higher (e.g. week no. 19, 24, 26, 43, 47 and 49) as compared to the actual observed cases.

(a) Weekly observed values (black bars), predicted values (red bars) and the climatology (blue line); and (b) probabilistic forecasts: % probabilities of Below Normal (BN), Near Normal (NN), Above Normal (AN) and Extreme (EXT) occurrences for MAL during 2013 over Nagpur. The left most bar represents the observed probability, middle bar represents the climatological probability and right most bar is for the forecast probability. For observation and climatology any of the above probabilities is 100%.
For the same year, the probabilistic forecasts i.e. percentage probabilities of BN, NN, AN and extreme occurrences (EXT) (please refer Data and Methods section) of MAL for NGP is shown in Fig. 4b. For each week, the left most bar represents the observed probability, middle bar represents the climatological probability and right most bar is for the forecast probability. For observation and climatology any of the above probabilities is 100%. The forecasted probability contains four categories as mentioned above and the % probability for each category is shown with the length of the four segments in the right most bar with different colours (red, yellow, green and blue for EXT, AN, NN and BN respectively). The significance of this plot can be explained in a much easier way with the help of Fig. 4a. For example, in Fig. 4a at week numbers 19 and 47 the prediction is more than the actual observation and the differences are high. However, it is observed from Fig. 4b that during these weeks the probabilistic forecasts with four different categories is providing much more realistic information i.e. showing (zero for Extreme and ~ 15% for above normal) more probabilities for NN and BN categories, against the observed probabilities of BN categories. Again for week numbers 24, 26, 43 and 49 where deterministic forecasts are much higher compared to actual, the probabilistic forecasts show high probability for NN and AN against NN categories in observations. There are other evidences where actual observation is large but the deterministic prediction is much on the lower side e.g. week numbers 2, 3, 22, 23 and 38. The categorical forecasts during the same weeks show reasonable probabilities of NN and AN against observed probabilities of AN. Again for week numbers 32 and 36 (where observed probabilities are EXT), the forecasts show high probabilities for AN with less probability of EXT categories.
The same analysis is done for other remaining years for MAL and ADD for both the regions and selective years are kept as the supplementary information (Figure S8-15). From the analysis of all deterministic and probabilistic forecasts, it can be noted that, the SOM based method could nicely capture the seasonal variability of occurrence of the diseases over these two different geographical locations, although it failed to predict the exact magnitudes in a few occasions. Also, it is found that the categorical probabilistic forecasts can provide more realistic and scientific information which can be very useful for policy making than the deterministic forecasts.
Real-time extended range forecast
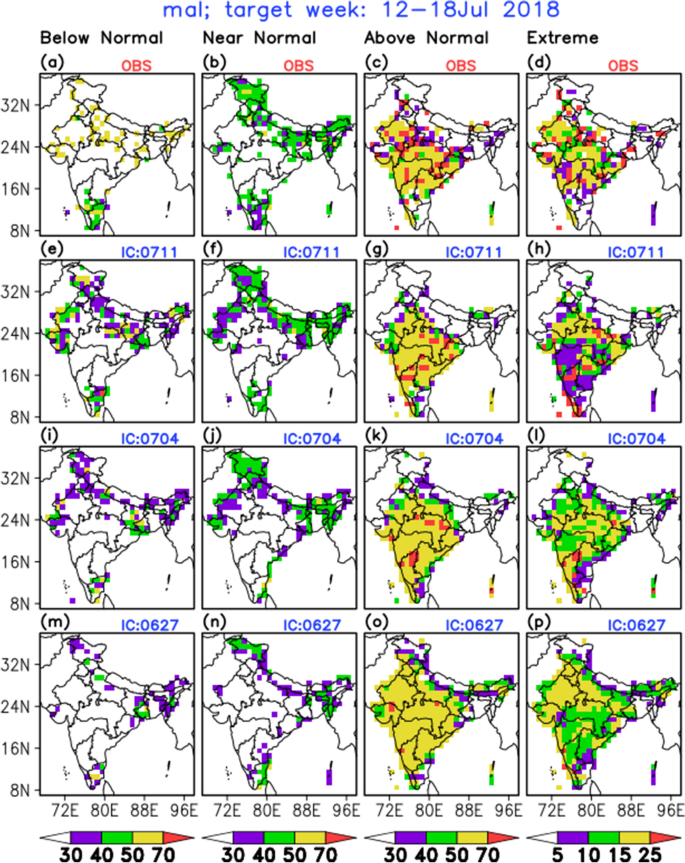
The previous skill analysis and probabilistic forecast verification give the confidence to use this 6 × 6 SOM based EHWS for the real-time extended range prediction (ERP) (i.e. 2–3 weeks in advance) of the incidence of these diseases. For the real-time ERP of MAL and ADD over the whole Indian region, the gridded data ((1^circ times 1^circ) resolution) of R/F, TMx and TMn (all bias-corrected) are considered from the model, a multi-model ensemble forecast system for weather parameters (please refer Data and Methods section). Figure 5 shows the verification of the model forecast for MAL cases during the target week 12–18 July 2018. From the observed climatological weekly number of MAL/ADD cases (Fig. 1), it is seen that July experiences very high number of cases. So the target week is arbitrarily chosen during that month. Figure 5a–d show the observed probabilities of BN, NN, AN and EXT categories respectively. Here, it will be worth mentioning that the observed number of MAL cases are not the actual recorded cases over all grids, but they are produced using the observed gridded R/F, TMx and TMn datasets as inputs in the SOM technique, by assuming that this model is perfect since we don’t have the actual observed health data for all grids of the country. This analysis is done only for the verification purpose. Figure 5e–h represent the same four categorical probabilistic forecasts based on the 11th July, 2018 initial condition (IC) i.e. week-1 lead. The same forecasts from 4th July (week-2 lead) and 27th June (week-3 lead) 2018 ICs are placed in Fig. 5i–l and m–p respectively. From the Fig. 5a, it can be observed that during this target week most of the places over India (except western, eastern and northern parts), the probability of BN occurrence of MAL is less and it is reasonably predicted by the nearest two ICs (Fig. 5e and i). For the NN category, over north, eastern parts and extreme southern parts experiencing about 40% or more probability (Fig. 5b), and which is predicted reasonably from all nearest three ICs (Fig. 5f, j and n) with the decreasing probabilities from farthest IC. Most importantly for the AN cases (Fig. 5c, g, k and o), the western, central, south-east and parts of south India are having higher probability ((>50%) and somewhere (>70%)), and the EHWS could predict this above normal type condition reasonably well from all the leads, though there are over predictions over parts of northern and north-eastern India from longer lead. The EXT category can be a great threat to the population. Figure 5d shows the observed pattern for MAL over the country for extreme cases, which shows that there is more than 15% chance over the north-west, central and south-eastern parts of the country and it is significantly captured by EHWS well in advance (Fig. 5h, l and p) albeit with some spatial error.

Probabilities of below normal (BN), near normal (NN), above normal (AN) and extreme (EXT) category of occurrences of MAL during 12–18 July 2018 for observation (a)–(d) and forecasts from initial conditions 11th July (e)–(h), 4th July (i)–(l) and 27th June (m)–(p) of 2018. (This map is generated using GrADS (version 2.0.2.oga.1), https://cola.gmu.edu/grads/).
A similar verification plot for MAL in the target week 05–11 July 2018, is shown in Figure S16. For ADD and target weeks 05–11 and 12–18 July 2018 the verification plots are provided as Figure S17 and S18 respectively. By analysing these three additional verification plots, it is observed that the newly developed EHWS is able to provide the chances (% probabilities of BN, NN, AN and EXT) of occurrences of MAL and ADD over different places of India reasonably well in advance that is at least 2 weeks in advance.


More Stories
MBA students teach incarcerated women career skills in new partnership
Electrical skills development boost for Antrim and Newtownabbey firms
Latest Diablo 4 Quarterly Update Shows Off Impressive New Skill Trees