
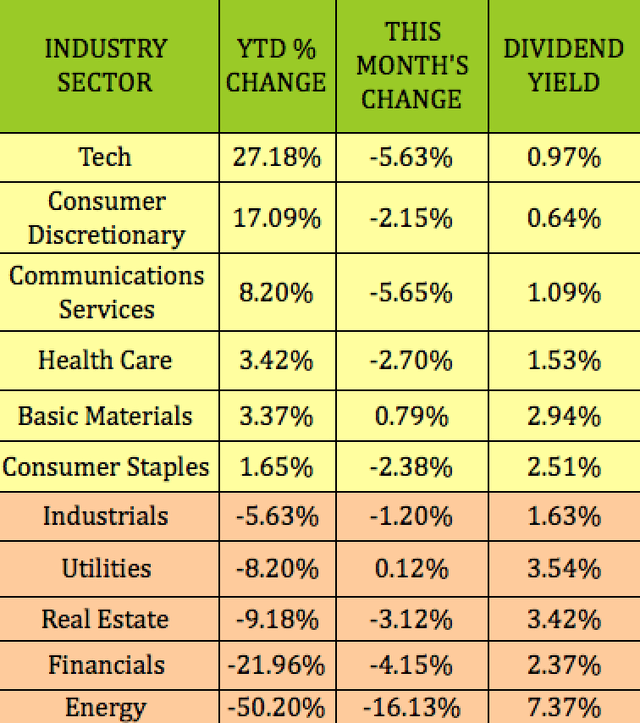
As we’ve often noted in our recent articles, high or even moderate dividend yields are hard to come by in the tech sector. Indeed, the top three performing sectors so far in 2020, tech, consumer discretionary, and communications services, have low dividend yields of .97%, .64%, and 1.09%, respectively.
 Income investors are often faced with the challenge of whether to try and trade in and out of stocks in order to reap capital gains vs. holding higher yielding stocks for income. Of course, in a topsy turvy year like 2020, that conundrum is even more challenging.
Some income investors use ETFs, mutual funds or closed-end funds to get a piece of the tech action.
BlackRock Science and Technology Trust (BST) is a CEF which offers you a way to solve the income problem, and still benefit from tech.
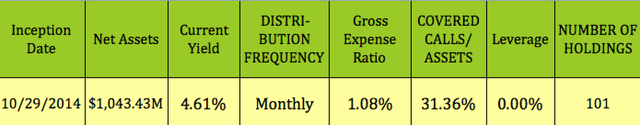
It currently yields 4.61%, pays monthly, and uses a covered call strategy to enhance its yield, with 31.36% of its assets overwritten by calls, as of 8/31/20. It has a gross expense ratio of 1.08%, with 1010 holdings:
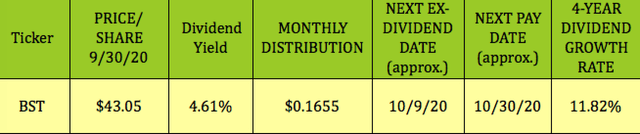
 BST pays $.1655/month. It tends to go ex-dividend in the 2nd week of the month, and pay at the end of the month.
It has a four-year dividend growth rate of 11.82%. The monthly payout rose from $.10 to $.11 to $.13 in 2017. It then rose from $.13 to $.15 in 2018. Management raised the monthly payout again, from $.15 to $.1655 in December 2019.
In December 2019, BST paid a special $1.6852 distribution, based upon capital gains, in order to satisfy the funds’ excise tax requirements. This was an outlier in size – the previous December’s special distribution was $.08.
 Taxes:
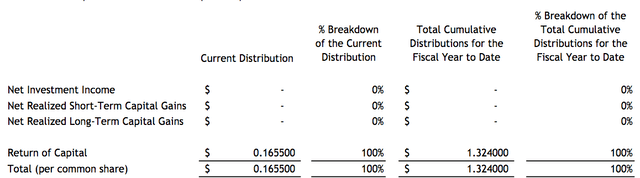
BST issues a 1099 at tax time. As of 8/31/20, its 2020 distributions were 100% return of capital. Investors get a tax deferral advantage from ROC, but you should be aware that it decreases your tax basis.
 (BST site)
Performance:
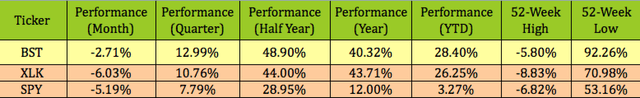
BST has outperformed the broad Technology Select Sector SPDR ETF, XLK and the S&P 500 over the past quarter, half year, and year to date in 2020.
Like other tech vehicles, BST is down over the past month,-2.71%, but still outperformed XLK and the S&P. While it has greatly outperformed the market over the past year, it has slightly lagged the XLK:
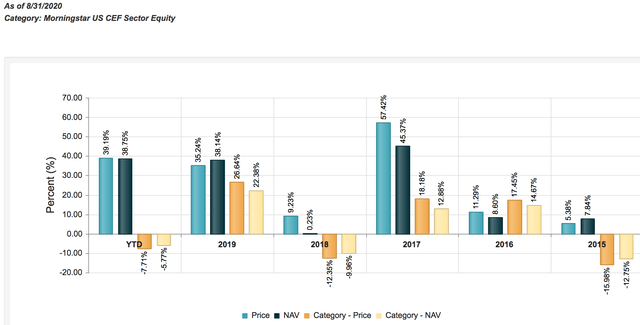
 Looking back further shows that, as of 8/31/20, BST outperformed the broad Morningstar US CEF Equity category on an NAV and price basis in 2019, 2018, 2017, and 2015, while underperforming it in 2016. It also has greatly outperformed that broad category so far in 2020:
 Pricing:
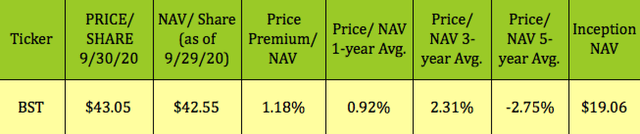
As of the 9/30/20 close, BST was priced at a 1.18% premium to NAV, which is higher than its one-year average price/NAV/share of .92%, lower than its three-year 2.31% average and higher than its five-year -2.75% average. That’s not surprising, given its outperformance in 2020. Its deepest discount in the past year was at the March lows, when it hit -8.37% in the COVID-19 crash.
 Holdings:
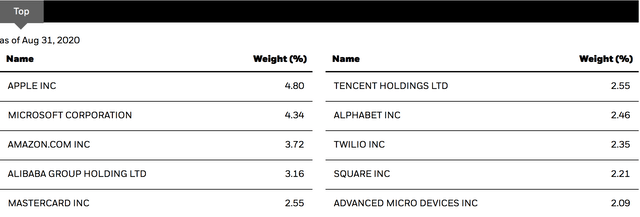
BST has 101 holdings, with very familiar Tech megacaps in its top 10 group, such as Microsoft (NASDAQ:MSFT), Amazon (NASDAQ:AMZN) and Apple (NASDAQ:AAPL), among others. The top 10 holdings comprise 30.2% of its portfolio.
 (BST site)
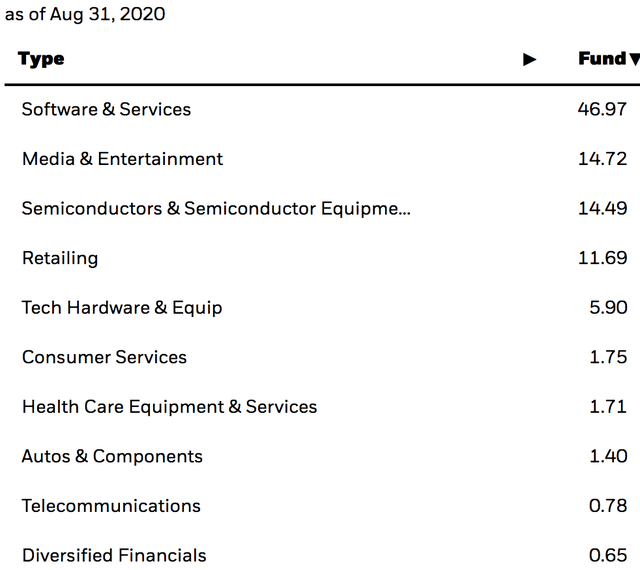
Its biggest sector exposures are in software and services at ~47%, followed by media/entertainment, 14.7%, semiconductors, 14.49%, retailing, 11.69%, and tech hardware, at 5.9%:
 (BST site)
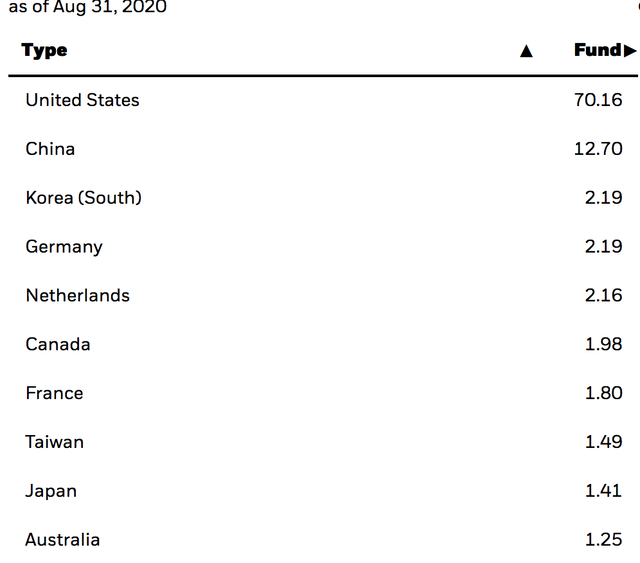
It holds 70% in US stocks, followed by China, at 12.7% – Tencent (OTCPK:TCEHY) and Alibaba (NYSE:BABA) are among its top 10 holdings, with ~2.2% or less in eight other nations:
 (BST site)
Summary:
BST offers income investors a reasonable yield of 4.6%, with monthly distributions that can help smooth out your cash flow. At $43.05, it’s priced at a 1.18% premium to NAV, which is higher than its one-year average price/NAV/share of .92%, but lower than its three-year 2.31% average premium/NAV.
One of the more dependable strategies when buying CEFs is to try to buy them at a deeper discount to NAV than their historical discounts. The NAV figures have a one-day lag.
All tables furnished by DoubleDividendStocks.com, unless otherwise noted.
Our Marketplace service, Hidden Dividend Stocks Plus, focuses on undercovered, undervalued income vehicles, including dividend stocks, bonds, preferreds, CEF’s and special high yield situations.
We scour the US and world markets to find solid income opportunities with dividend yields ranging from 5% to 10%-plus, backed by strong earnings.
We publish exclusive articles each week with investing ideas for the HDS+ site that you won’t see anywhere else.
We offer a range of income vehicles, many of which are selling below their buyout and redemption values. Our latest success is an 18% return in 5 months on an early bond redemption.
Disclosure: I am/we are long BST. I wrote this article myself, and it expresses my own opinions. I am not receiving compensation for it (other than from Seeking Alpha). I have no business relationship with any company whose stock is mentioned in this article.
Additional disclosure: Disclaimer: This article was written for informational purposes only, and is not intended as personal investment advice. Please practice due diligence before investing in any investment vehicle mentioned in this article.


More Stories
Stevens and Seton Hall University Announce Dual-Degree Program
Science and Technology Minister Harsh Vardhan launches CSIR technologies for rural development
NanoAffix Science one of six Wisconsin companies to get state and federal funds to help commercialize products